No more searching through 1,000 tabs and a dozen websites. All of the data and research tools that you need to analyze soccer props in one place.

Interactive data at your fingertips to break down shots, corners, crosses, shots on target and much more.

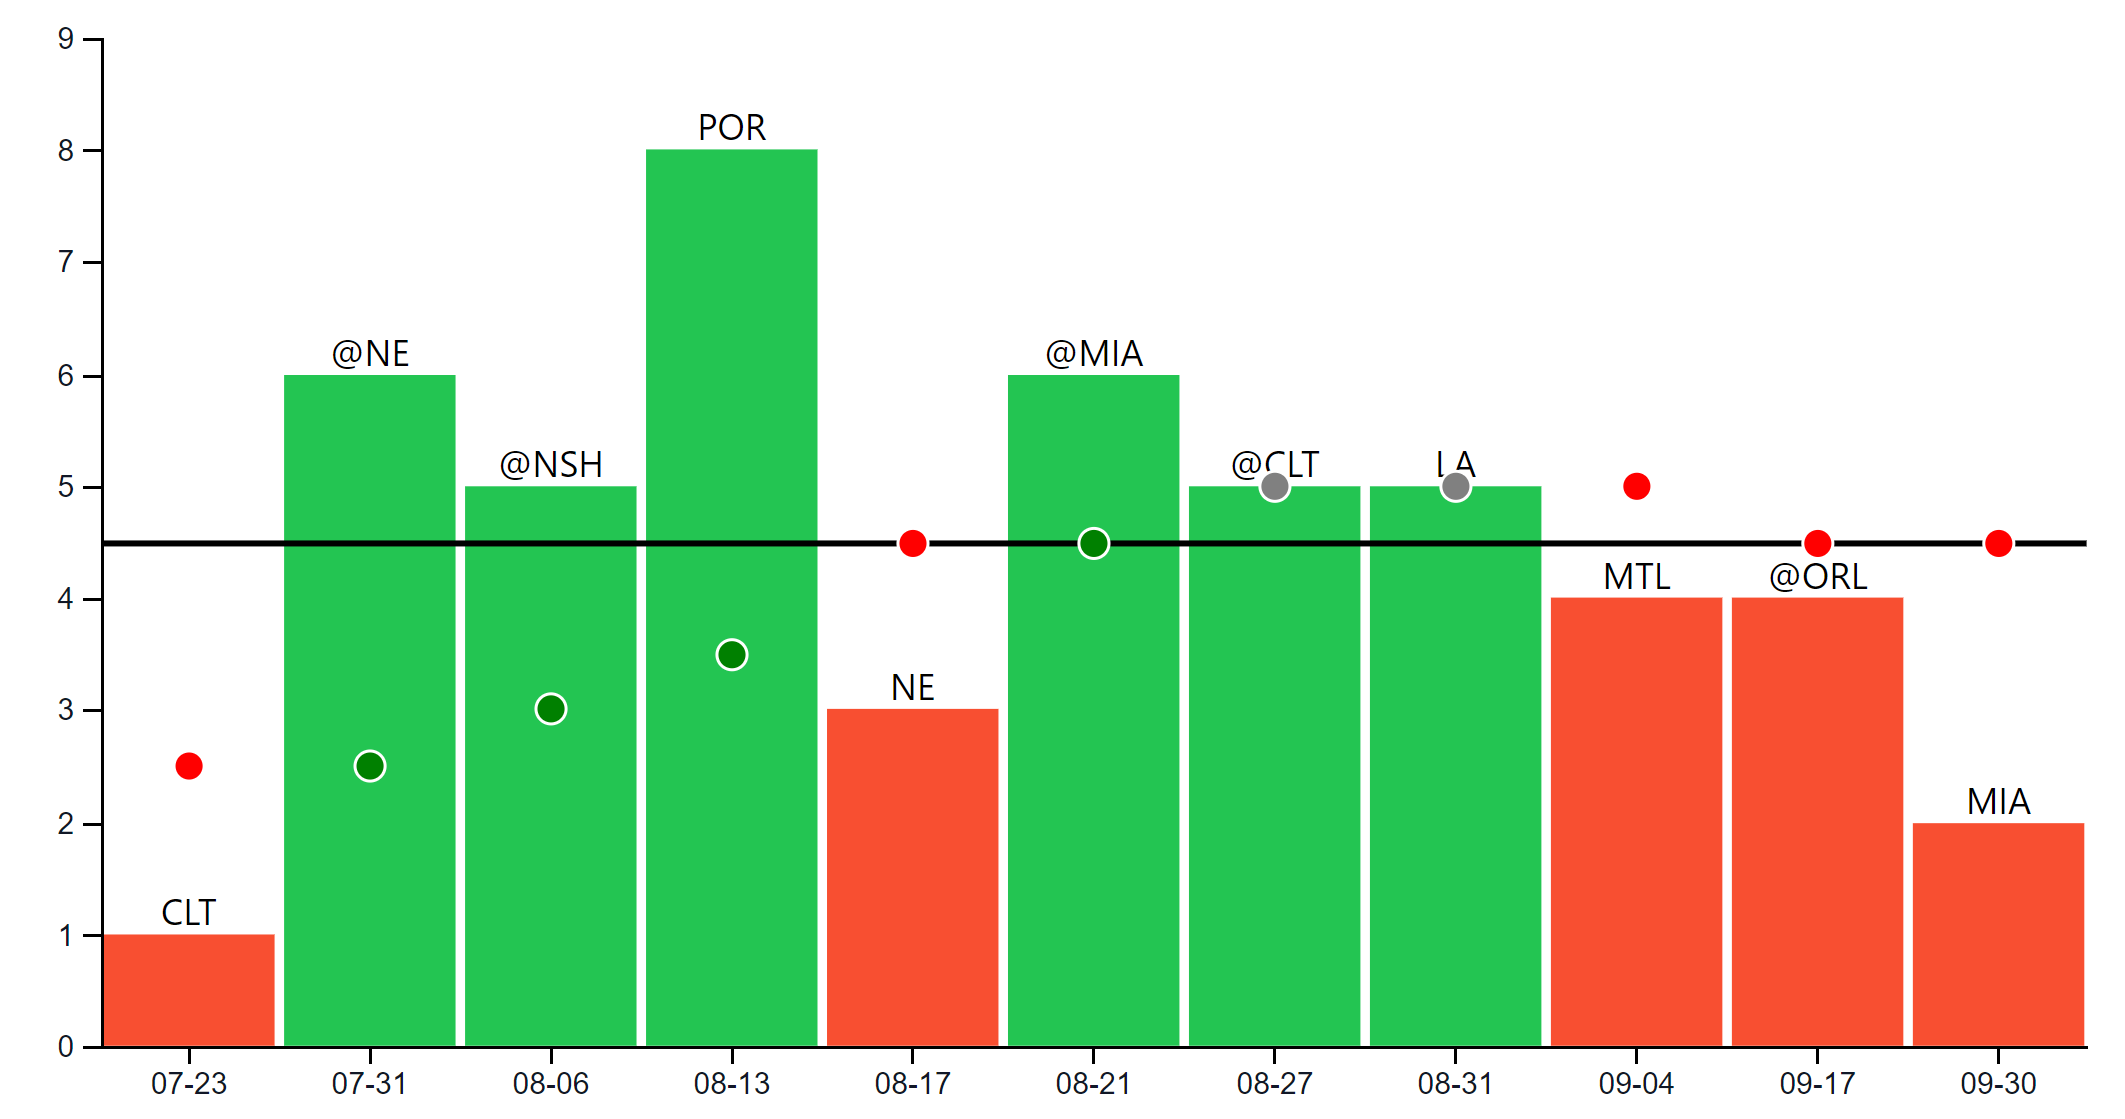
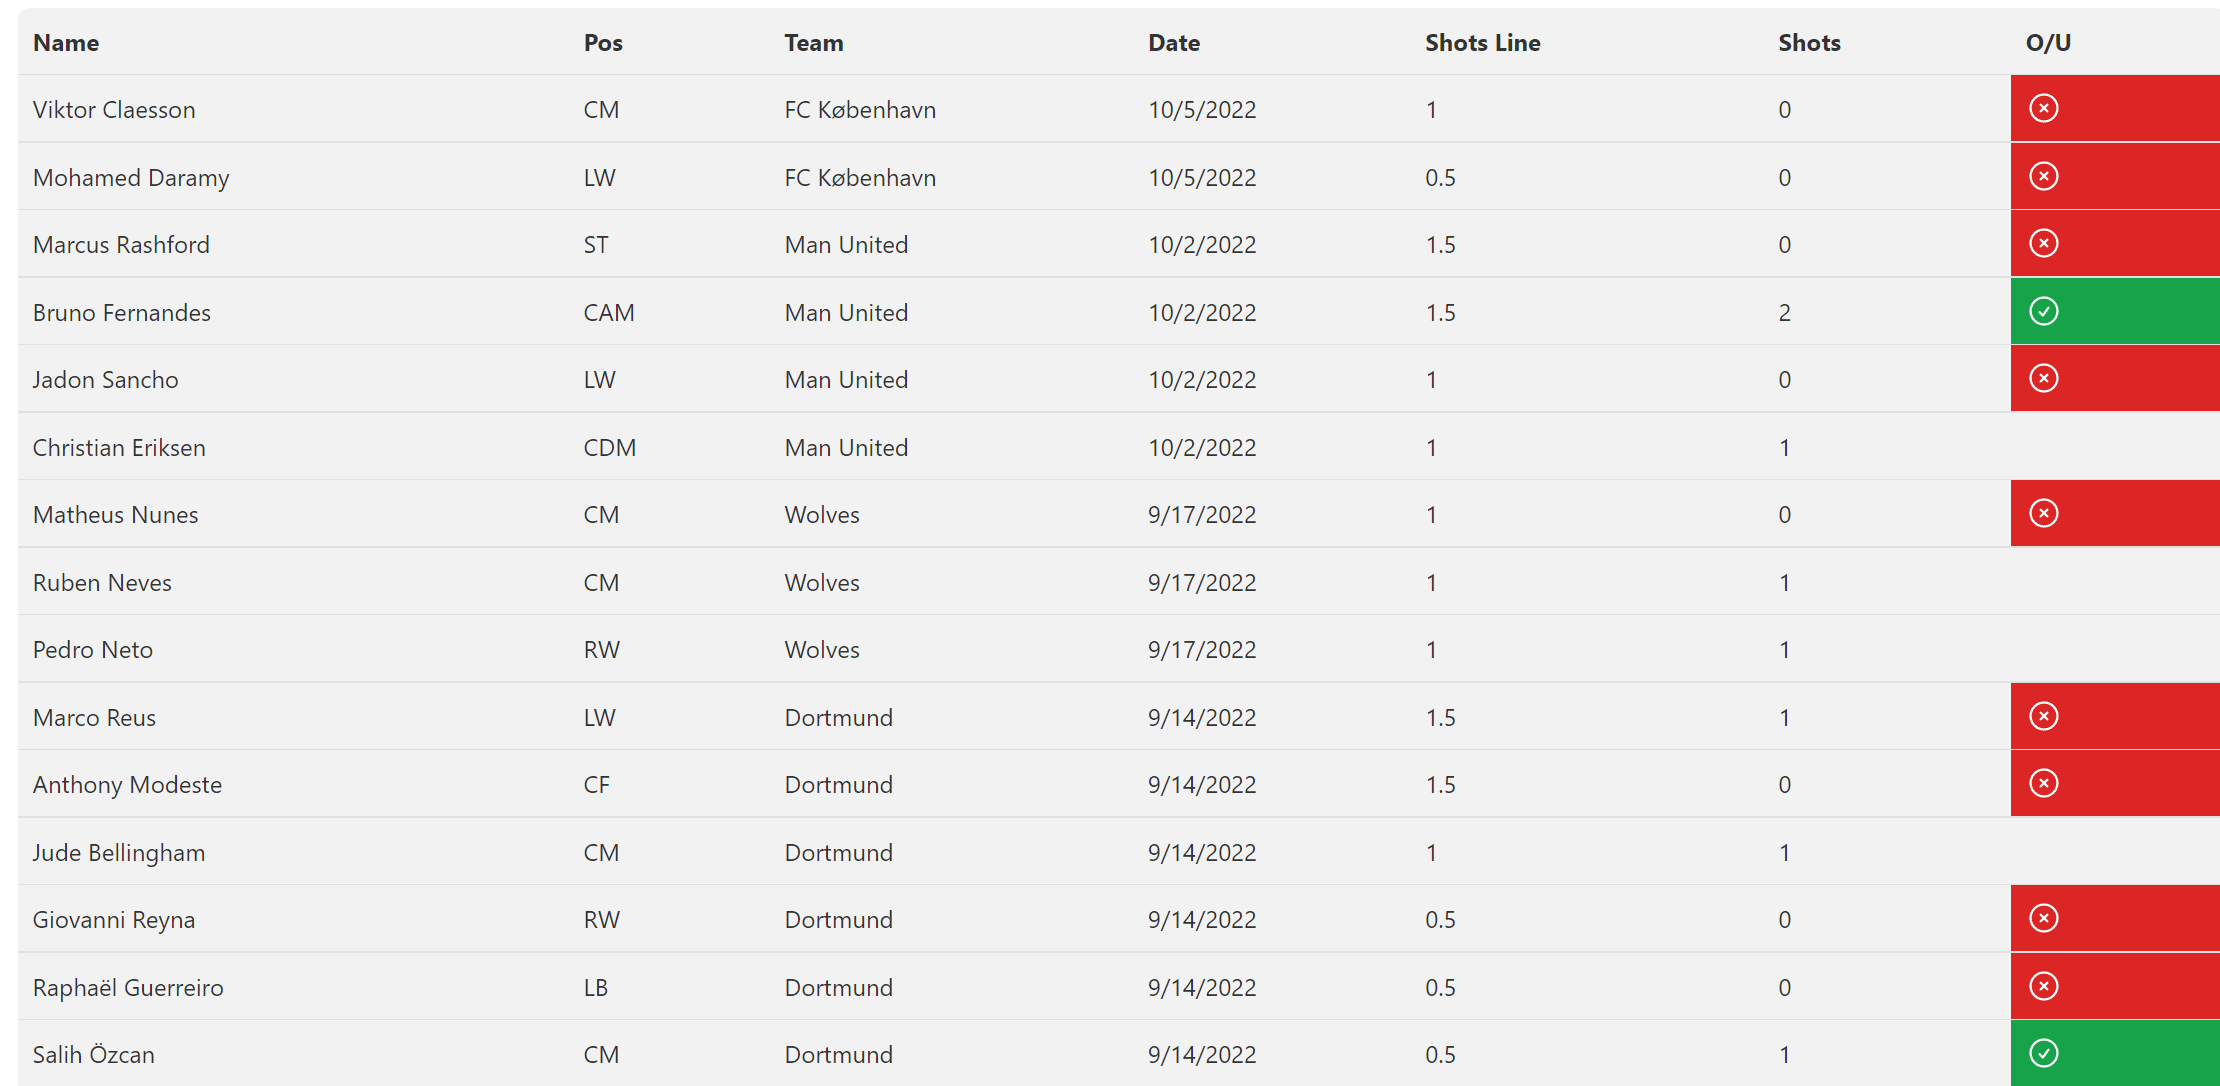
Our player pages allow you to compare performance against historical PrizePicks lines. Bars are red or green based on hit rate vs. current lines with green or red circles to show historical lines.

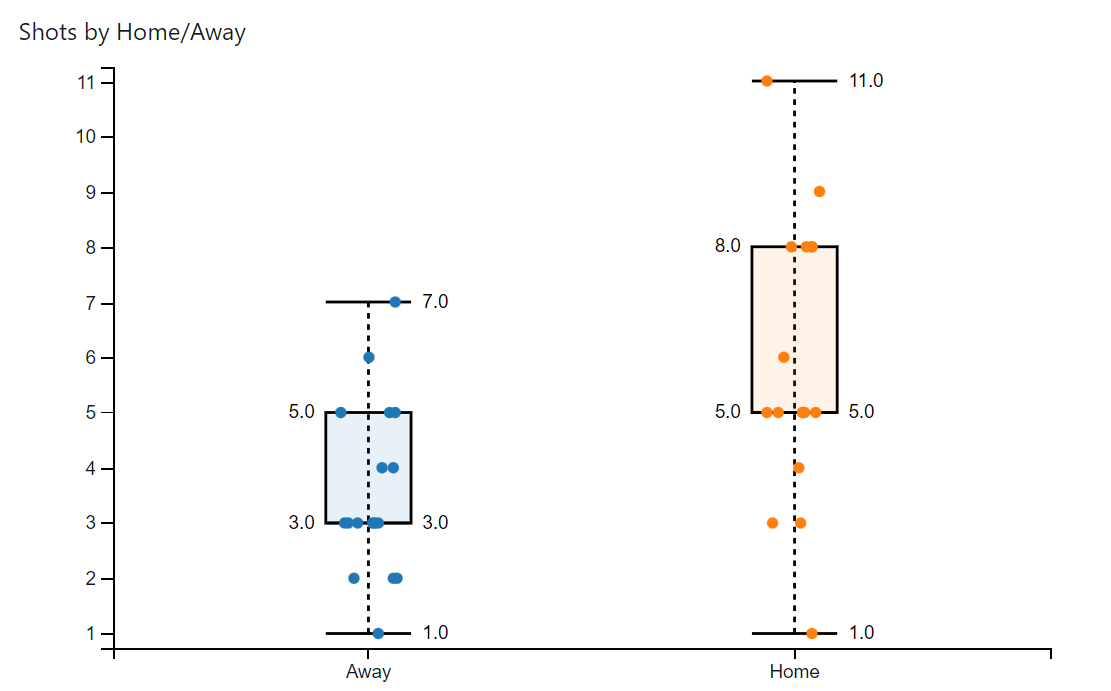
All graphs on the player pages are clickable and will filter the game log. This allows you to quickly filter on extra dimensions like home/away, game result, team possession, recent games and much more!

Our team pages have individual stats like penalty logs, corner kicks and free kick shots. They also show how players have performed against a team relative to their lines.

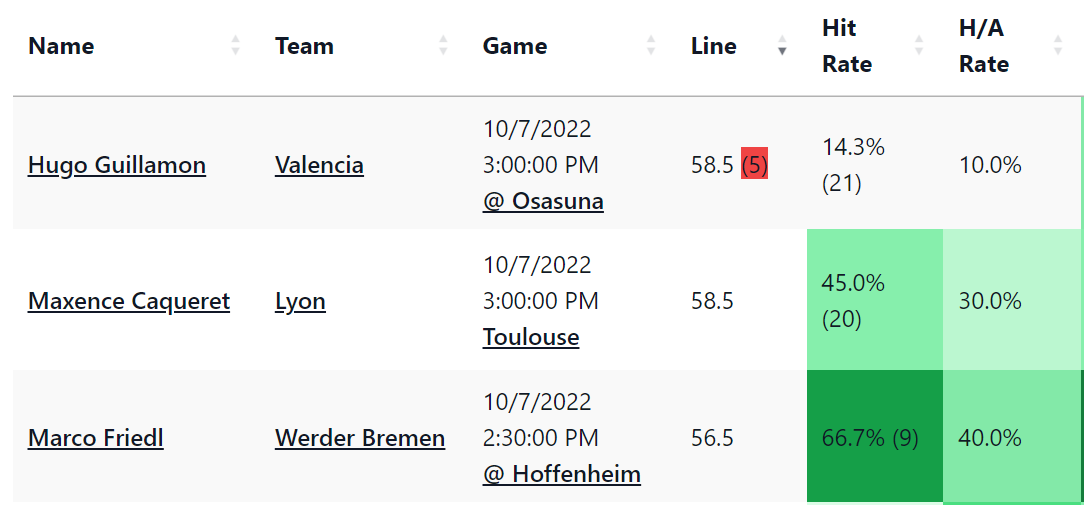
Our prop board shows every prop on the board and is easily sortable and filterable with hit rates, home/road hit rates and recent performance. This is the best way to find board errors, outliers and track line movement.